Comparing Data in Google and Netlify Analytics
tldr; the datasets weren’t even close for me.
In my (limited and anecdotal) experience, Google’s and Netlify’s analytics offerings report drastically different numbers given an identical timeframe. Granted, there are likely conceptual differences in the language each product uses to define their analytical data points (does “Pageviews” in Netlify mean the same thing in Google Analytics?). I’m not interested in spending time reconciling those differences. More than conceptual differences in language use, the more fundamental difference between these two datasets is that one is collected server-side, the other client-side. So in my mind, what follows is not specific to Netlify Analytics. I would imagine these kinds of data discrepancies would show up in any set of website analytics where one comes from the server, one from the client.
It’s also worthing noting that I found out Netlify counts bot traffic while Google Analytics does not. So (even though this may seem obvious, I’m going to say it) we’re not talking purely about implementation details of server-side vs. client-side analytics collection. There are fundamental differences in how the data is collected, so even if both products are using the same language (i.e. a “Pageview” is the same thing in both) to try and capture the same conceptual thing, the implementation details do matter and dictate that you are not guaranteed to end up with anything that’s similar.
If there’s anything I’ve learned from writing this blog post, it would be the following:
- Never assume too much from a single set of data. In other words, don’t draw all your data-driven insights from one basket.
- Server-side analytics are a lot more representative of the reality I’m looking for than client-side analytics.
Background
I’ve used Google Analytics for years on my icon gallery sites. I’ve never really used the analytics for anything other than satisfying my own personal curiosity. I haven’t found data-driven metrics to be of much use on these sites. I like to ignore what any specific collection of data might suggest. Doing so lets me focus on my love of building stuff for the web. For these kinds of personal projects, I feel similar to Jonnie and his desire to remove analytics from his personal blog:
Not seeing any metrics is actually refreshing and feels so much healthier than having that addiction. It lets me focus on my love of writing and makes me not care as much about fine-tuning or being perfect.
When Netlify Analytics came along, I was much more interested in that product because it was server-side instead of client-side (less code shipped to client, no more tracking, etc.). Netlify Analytics seemed like the right tool that would let me have my cake and eat it too: analytics for my own personal curiosity without any extra cost to the user. So I enabled Netlify Analytics for my sites and let it soak for a while.
And then I forgot about it and was left with two sets of analytics data being gathered. Then a couple days ago, I remembered what I’d done. I decided before removing Google Analytics I’d compare the data and see if they tell the same story.
They didn’t. They told a totally different story from each other.
Location
Google Analytics has always led me to believe that my primary base of viewers comes from...drumroll...China? For a number of years it was the United States, but sometime a few years back (maybe circa 2016-ish?), I noticed that—according to Google Analytics—China became the number one country sourcing viewers to my site.
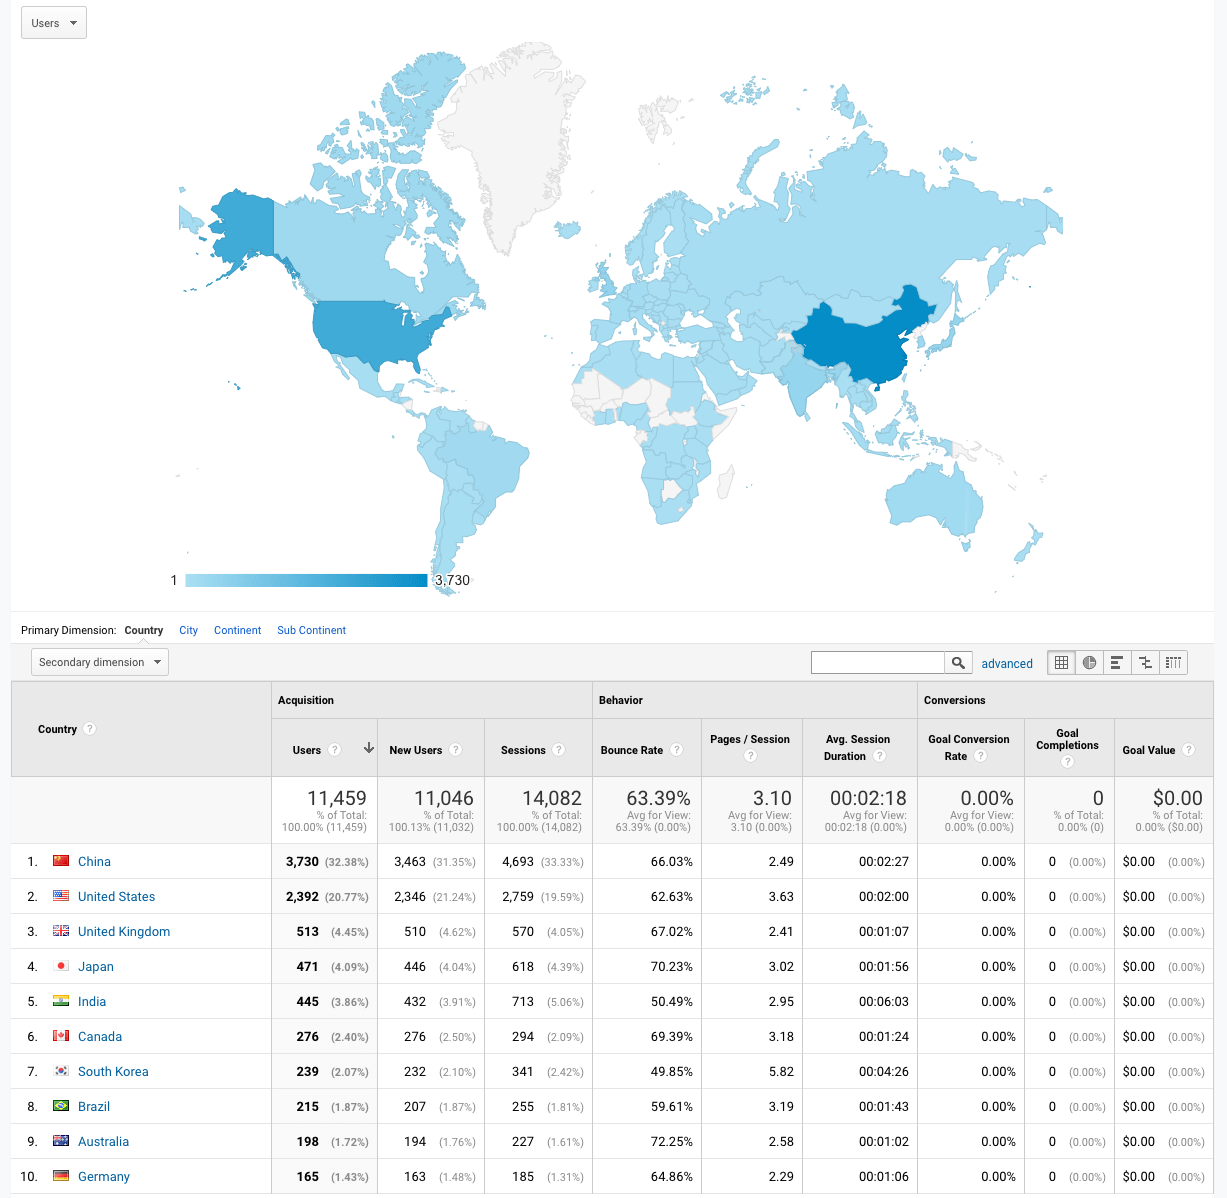
I honestly don’t know what to do with that statistic. Maybe support internationalization? I’m not going to do that in my free time. Plus, the primary purpose and driving value behind the site is the icons themselves, which are visual and don’t need translation. So I just tucked that little nugget of information away in my head as an interesting fact.
But then Netlify Analytics came along and had something very different to say about the geographic location of my viewers. Sliced from the same timeframe as Google Analytics, it tells a drastically different story.
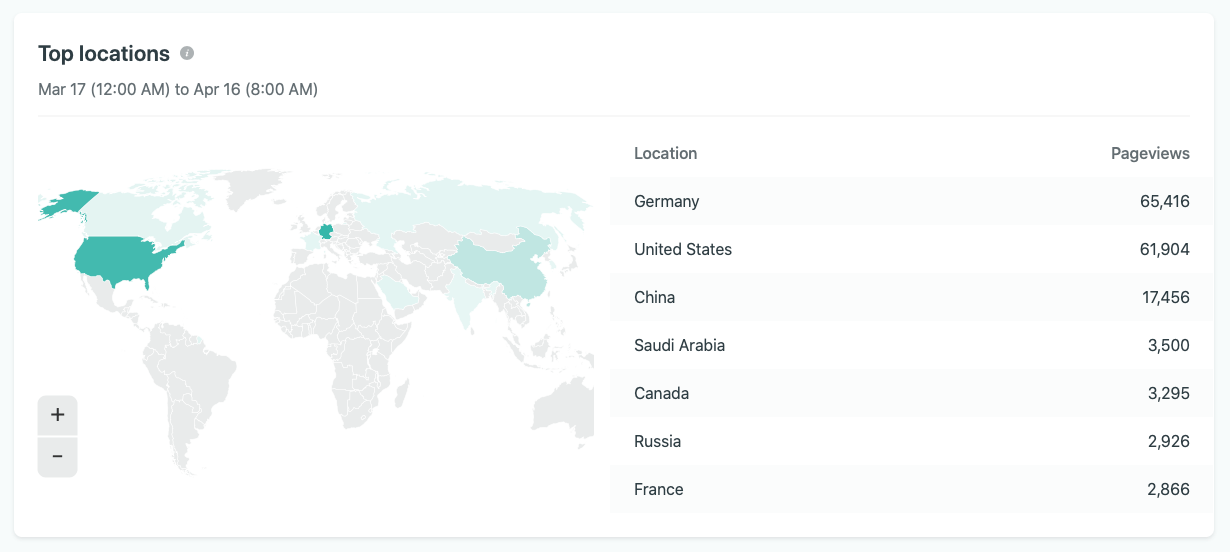
It’s rather interesting how wildly Netlify and Google differ on reporting the geography of my site’s viewers. I’m sure if I delved into exactly how they calculate and report on what, I could possibly figure out why the datasets are different. But honestly, I’m not that interested.
Top Pages
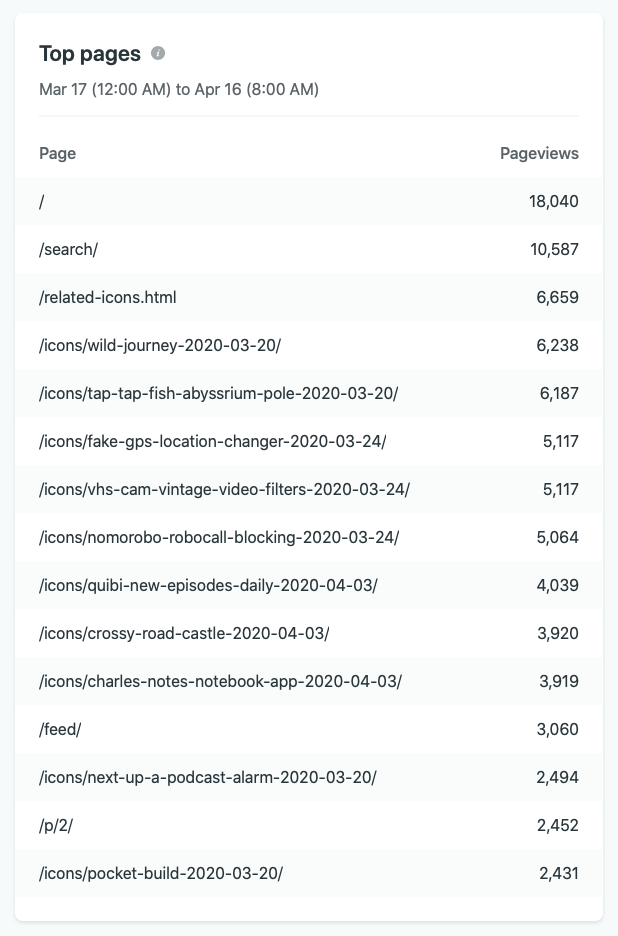
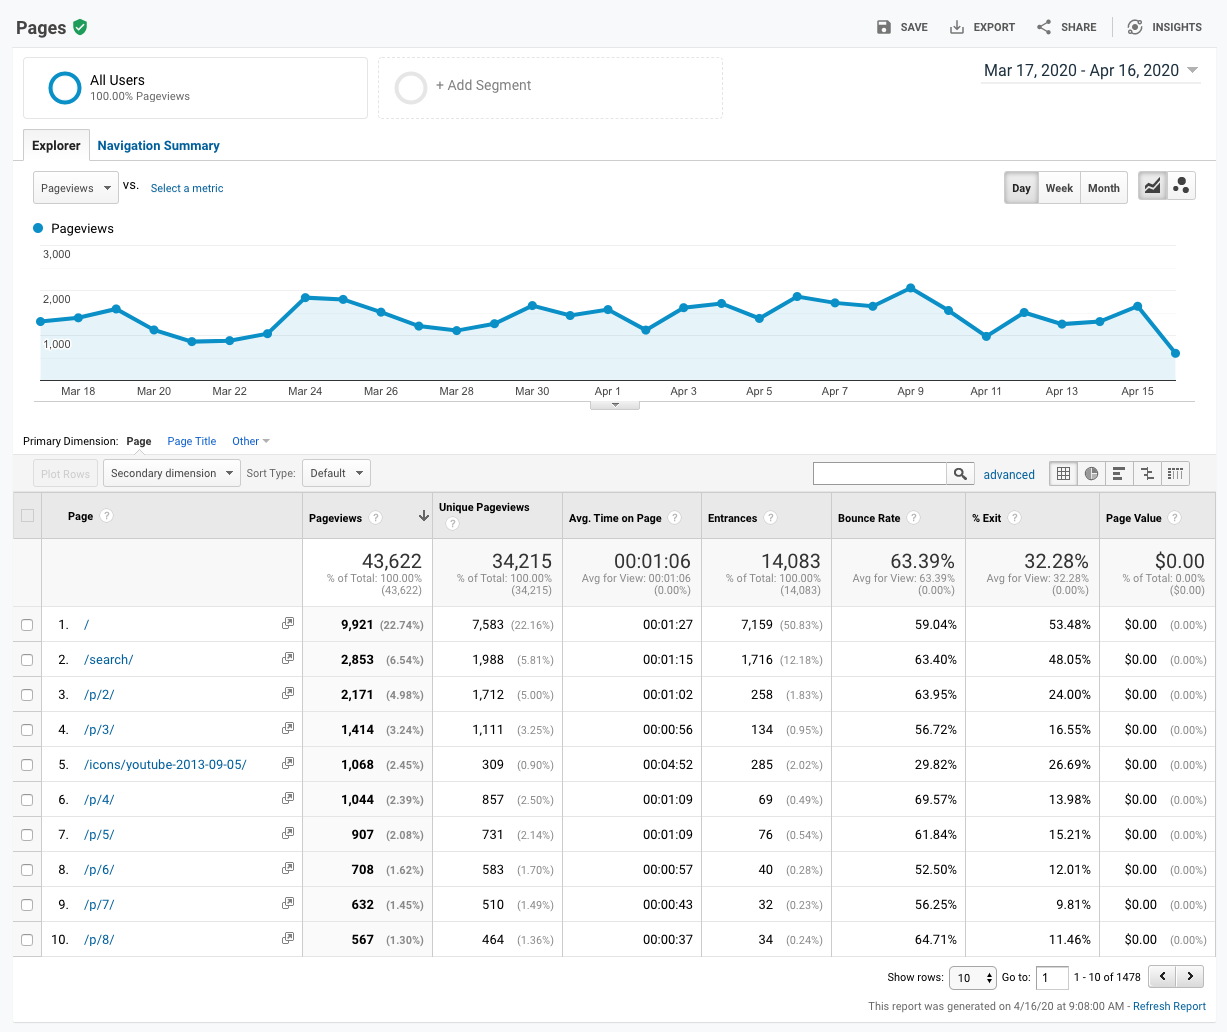
The data around “Top Pages” seems to agree in some regards, but not in others. For example: both Netlify and Google agree that / and /search/ are the most commonly-visited pages (though they drastically disagree in numbers, Netlify putting / at twice the page views that Google does, /search/ at three to four times as many). Beyond those first two statistics, Netlify and Google present a very different view of what’s happening on this website.
Netlify seems to suggest that—apart from home and search—individual icon pages are the most popular. This would make me think lots of people are visiting individual pages, likely as a result of direct links from other pages. Google, on the other hand, suggests that the pagination pages are the most popular (/p/2, /p/3, etc), indicating that perhaps the way people use the site is by paginating through all the icons. Who knows? (And to be honest, who really cares?)
What’s interesting and insightful about Netlify’s analytics is that I can see what “pages” are popular that don’t have JavaScript embedded in them. For example, the third most popular “page” according to Netlify is my /related-icons.html page. Being as familiar with the site as I am, I know that document is an HTML partial, never intended to be viewed on its own. Instead, it's a collection of HTML data used to populate the “Related Icons” module on each individual icon’s page. It doesn’t have <meta> tags, <link> tags, or any <script> tags. It’s basically like a JSON file but in HTML, and therefore doesn’t have a Google Analytics script embedded in it—which means it doesn’t show up on the radar of Google Analytics whatsoever. But because of Netlify’s ability to see requests on the server’s side, I can see just how popular that page is (and therefore how many people are using the “View Related Icons” aspect of the site).
Pageviews
So this is interesting. “Pageviews” for the same given period result in very different numbers:
- Netlify Analytics: 185,157
- Google Analytics: 43,626
Here are the definitions of these pieces of data according to the tooltips in their respective products:
- Netlify: “Instances of your site’s pages being served.”
- Google: “Pageviews is the total number of pages viewed. Repeated views of a single page are counted.”
So I have data that is telling two very different stories using the same language, at least on the surface. What do I believe? Who knows (or has the time to figure it out)?
Unique Visitors
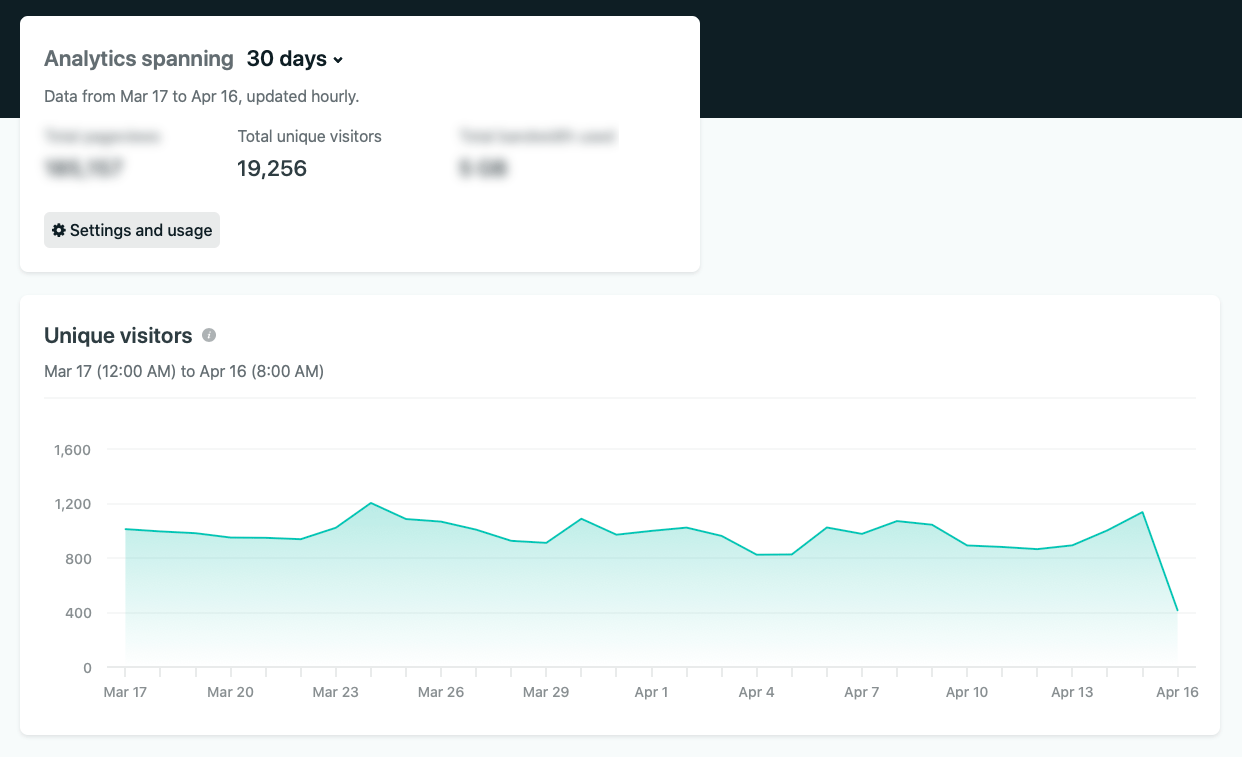
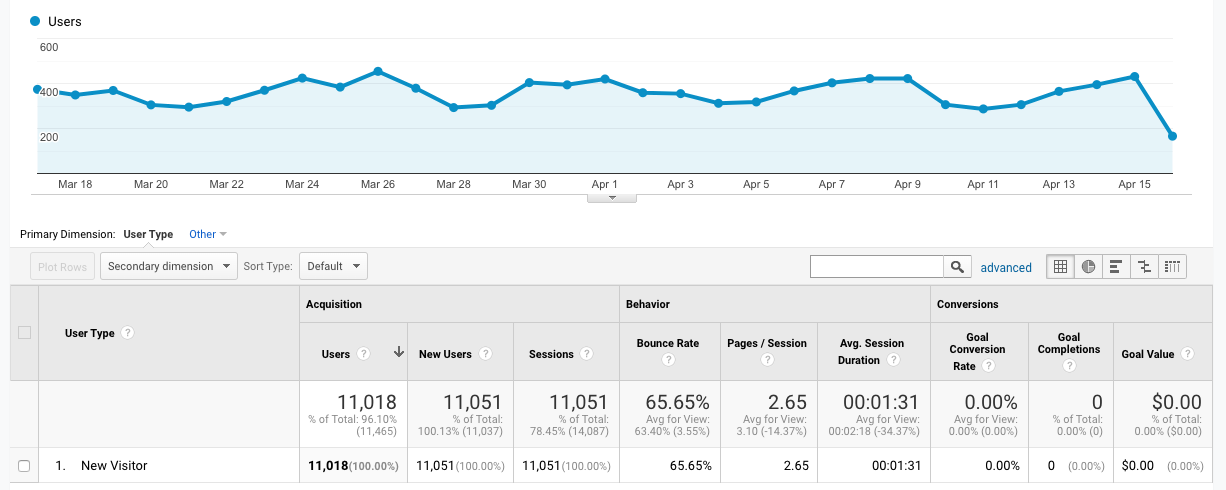
Now here’s a look at new/unique visitors. I think this is conceptually comparing apples-to-apples, but it might not be. In this particular case, as I understand it, Google Analytics uses a number of tracking methods (cookies as an example) to gather its data.
Another factor to consider when looking at the users statistic is the number of web browsers each person is using on their computer. Google Analytics uses tracking cookies to keep tabs on each individual user and tracking cookies are dependent upon the browser. That is to say, Firefox only looks at the cookies created by Firefox. Chrome only looks at the cookies created by Chrome. Internet Explorer, Safari, Opera, and whatever other browser anyone happens to use do exactly the same thing. Therefore, if a person visits the same website from the same computer but uses three different browsers to do it, that will register as three unique users as far as Google Analytics is concerned.
Based on that piece of information, you’d think Google’s numbers would be inflated, but I got the opposite? Again, Google’s data is purely client-side, so who knows what has slipped through the cracks of “JavaScript disabled” or “JavaScript failed” or ad/script blockers or any other number of things. And Netlify’s data counts bots. So again, I don't really know what source to trust here.
404s
Netlify has this great little slice of data called “Top Resources Not Found”. It gives me insight into the top hits on my domain for which Netlify has no static asset to serve.
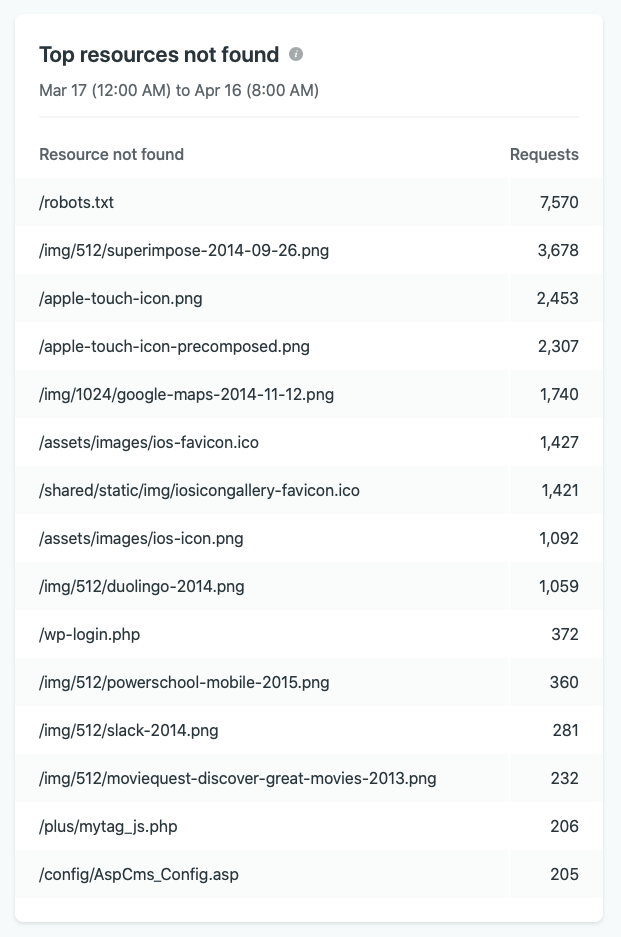
As far as I can tell, you can’t get data like this from Google Analytics, which makes sense since GA is purely client side. How could it track information on a request to a non-HTML file like robots.txt which doesn’t embedded the GA <script>? Apparently you can try to fix crawl errors with Google Search Console by I’ve never tried that and dare not say anything more on the matter for fear of appearing completely ignorant.
Anyway, I always find this slice of data in Netlify’s analytics quite interesting. It’s helpful in identifying any glaring resources I might be missing (“oh hey, I don’t have a robots.txt for my site”) but most of the time it gives me insight into three things:
- Missing conventional assets
- Broken links to static assets
- Security vulnerabilities
1. Missing Conventional Assets
There are a number of conventional assets that are expected for every website and browsers often automatically make requests for those assets, even if they’re not explicitly declared in the HTML. For example, the favicon is generally expected to be at the root of the web server at /favico.ico. You can specify exactly where it is (and what type of file it is) by putting some meta info in your HTML document’s <head>, but many clients just automatically look for it in this conventional location. I have a /favicon.ico, so I don’t see that one show up in my analytics. But there are a few others that I've chosen to not supply with my website, like /apple-touch-icon.png or a robots.txt file. Netlify’s analytics shows me just how prevalent requests for these files are. Makes me think twice about adding them—but to be honest, I probably won’t.
2. Busted Links to Static Assets
I always try to preserve the URLs to my pages but I don’t really try to do that with static assets. I change those when I want. Turns out, there are a number of people who hotlink to those assets. For example, I found there was some site out there on the web that had a Google Maps icon in their footer next to their address and they weren’t hosting that icon on their own site. They were hotlinking directly to the icon hosted on my site. So when I changed the URL to that image, I updated it in all the relevant files on my site but it broke for anyone out there who was linking directly to the file itself (instead of the canonical HTML file which linked to my assets).
To be honest, I don’t feel bad about breaking that. This seems like a standard thing. Your projects change over time. You have to shuffle around the directory structure. As long as I keep my canonical HTML URLs from breaking, I feel like a good citizen of the web.
In this case, I find it very interesting to look at Netlify’s analytics and see which assets were apparently very popular for hotlinking.
3. Security Vulnerabilities
Feels pretty good to look at my "Top Resources Not Found" in @Netlify analytics and think, "glad I don't have to worry about any of these"
I actually always find it quite interesting to see what people are looking for on my site’s domain and not finding. Someday I might investigate this and see what all of these things are.
Conclusion
I honestly don’t know what to do with any of this knowledge. If anything, this little exercise made me lose a lot of faith in the conclusions I could draw from Google Analytics data. As I’ve used GA for the last decade on these sites, I’ve made a number of assumptions about how the site is used. Netlify Analytics made me question just about everything I thought I knew about my site’s visitors based on previous assumptions from Google Analytics data.
In the end, I put more merit behind Netlify’s analytics than I do Google’s because Netlify’s analytics are server-side which removes a lot of the “yes, but” caveats you have to remember when reading GA’s data. For example, because Google’s tracking is client-side and relies on JavaScript, it can’t capture any data around people who either don’t have JavaScript enabled or it failed to execute (for who knows what reason).
I’ve already gotten rid of Google Analytics on a number of my sites, just because I don’t love burdening the user with additional page weight and tracking. I held off keeping it on my icon gallery sites because it was always amusing for me to look at. Now I realize just how significantly prone to error my assumptions were from the data in Google Analytics. Now it just feels like, in addition to all the user-related concerns, if GA can’t amuse me with truthful entertaining details about my site’s data, what’s the point of keeping it?